Sound Localization in Adults: Correlation with Varying Pure Tone Averages
Article information
Abstract
Purpose
The present study examined sound localization in terms of varying hearing threshold levels as well as age and sex.
Methods
Fifteen healthy volunteers participated with varying mean pure tone averages (mean PTA). Using speaker systems evenly separated by 15˚ from 0˚ to 75˚ to the left and right sides (11 speakers), sound localization error was calculated. Correlation was computed between localization error and various methods of averaging PTA. Three averages were compared: full test frequency range averaging, 6 frequency weighted average used for diagnosing hearing loss and 6 frequency average for Enforcement Decree of Industrial Accident Compensation Insurance Act.
Results
First of all, sound localization error positively correlated with age and hearing threshold. The positive correlation was preserved with three averaging methods, with strongest significance with the full range averaging.
Conclusion
The present results imply that various averaging methods equally provide significant correlation by the function of localization error.
INTRODUCTION
The ability to locate exact direction and distance of a sound source is critical for surviving, which requires binaural hearing. Localization of a sound depends on several cues, among which time- and intensity-difference constitute major cues. Auditory system computes the difference of the arrival time of a sound at the right and the left ears to determine the direction (interaural time difference). Also, the binaural difference of the intensity of a sound (interaural level difference) is used to determine azimuth (Kerber & Seeber, 2012; Kwon et al., 2001). In this way, binaural hearing makes the auditory system to find out the differences between the right- and left-sided signals in a very fine-grained way and to integrate them into binaural information (Seebacher et al., 2019). In most situations, this occurs automatically and without much effort. For this reason, sound localization error has been examined in groups with various hearing problems, such as in populations with congenital unilateral hearing loss (Távora-Vieira & Rajan, 2015) as well as in populations with tinnitus (Hyvärinen et al., 2016) and even in the patients with ischemic cerebral stroke (Przewoźny et al., 2015). Single-sided deaf patients, for example, suffer much in localizing sound sources. To solve this difficulty of localizing due to insufficient binaural hearing, many devices such as, the bone anchored hearing aid, contralateral routing of signal hearing aid, and cochlear implant, were developed and have been widely used (Park et al., 2013; Seebacher et al., 2019).
As such, studies looking at patient group are plenty but normative data are insufficient for now (Dorman et al., 2016). Moreover, the pure tone averages (PTAs) used for examining correlation with sound localization error are various, even though there are sometimes guider consensus papers available (Kerber & Seeber, 2011), for instance, for unified testing framework in single-sided deafness studies, where PTA is defined as the mean thresholds at pure-tone frequencies of 500, 1,000, 2000, and 4,000 Hz (Van de Heyning et al., 2016). There is a study which used different PTAs for normal healthy group (125, 250, 500, 1,000, 2,000, and 4,000 Hz) and for bilateral hearing aided group (250, 500, 1,000, 2,000, and 4,000 Hz) (Dorman et al., 2016), though understanding of the specific study and the participants are probable. Averaging of 11 frequencies has also been used (0.125, 0.25, 0.5, 1, 2, 4, 8, 9, 10, 11.2, and 12.5 kHz) in a study investigating age-related hearing loss in regard to sound localization (Otte et al., 2013).
In the current study, we aimed to investigate the ability of sound localization in terms of various pure tone averaging methods as well as age and sex. Though PTA has been defined by International Organization for Standardization/1964 and American National Standards Institute/1969 as a mean air-conduction threshold level, several formulae are also in use for clinical or legal purposes (Lim & Chae, 2012). Therefore, three PTAs were used for comparing in the present study: Averaging full range frequencies tested (Full9), weighted averaging of 6 frequencies used for diagnosing hearing disability (Weight6) and averaging 6 frequencies used for Enforcement Decree of Industrial Accident Compensation Insurance Act (Comp6).
MATERIALS AND METHODS
Participants
Fifteen adults participated in the study (7 female; 8 male) between the age of 37-72 years. All were right-handed, native Korean speakers and without neurological or neuropsychological history. Before participation, they were screened using Korean version of mini-mental state examination to screen out participants with probable chance of dementia or severe working memory problems (Lee et al., 2002) but all have passed the test and participated the study. Written consent was provided before participation.
Audiological tests
Pure tone audiometry
Audiological testing was carried out with the participants sitting in a sound-treated room. Prior to testing, sample stimuli were presented to ensure audibility and to familiarize the listeners with the tasks. Stimuli are pure tones at octave frequencies from 125 Hz up to 8,000 Hz including two inter-octave frequencies 0f 3,000 Hz and 6,000 Hz (Audiometer device: Resonance r15c; Resonance, Gazzaniga, Italy).
Full9: PTA by averaging full range frequencies tested: Since we collected from 9 different frequencies, we computed as following.
[(1 × 125 Hz) + (1 × 250 Hz) + (1 × 500 Hz) + (1 × 1,000 Hz) + (1 × 2,000 Hz) + (1 × 3,000 Hz) + (1 × 4,000 Hz) + (1 × 6,000 Hz) + (1 × 8,000 Hz)] / 9
Weight6: PTA by weighted averaging of 6 frequencies were computed as following.
[(1 × 500 Hz) + (2 × 1,000 Hz) + (2 × 2,000 Hz) + (1 × 4,000 Hz)] / 6
Comp6: PTA by averaging 6 frequencies.
[(1 × 500 Hz) + (1 × 1,000 Hz) + (1 × 2,000 Hz) + (1 × 3,000 Hz) + (1 × 4,000 Hz) + (1 × 6,000 Hz)] / 6
Horizontal sound source localization
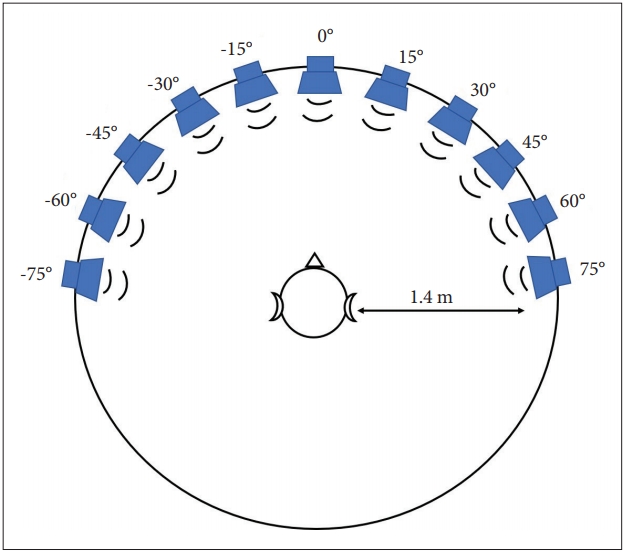
Localization test was also performed in a sound-treated room. Prior to the test, sample stimuli were presented to ensure audibility and to familiarize the listeners with the task. 11 speakers were separated by 15° from 75° to the right and from 75° to the left as shown in Figure 1. Each participant was instructed to identify the speaker of the sound source by reporting the number of the loud speaker and then immediately return to midline waiting for the next sound to be heard. A total of 44 sounds were randomly heard among 11 speakers.

Speaker array for sound localization test. 11 speakers were used from 0° to 75° in both to the left and the right equally separated by 15°. Stimulus heard was a 500 msec long broadband noise (125-8,000 Hz) with 10 msec rise and fall each.
The stimulus used is broadband noise (125-8,000 Hz) lasting for 500 msec with 10 msec rise and fall each. Intensity of the sound stimuli were set at 65 dBA. In the test session, no feedback was provided, to prevent learning of remaining direction-covariant acoustic features (e.g., room acoustics, reflections, and loudspeaker frequency responses). Localization performance was quantified as the total root mean square error of the speaker angles. Therefore, a lower root mean square error indicates better localization skills (Van de Heyning et al., 2016). Percent correct (%) was also obtained from each participant.
Simple t-test was performed to test group (male and female) difference in sound localization error and correlation was estimated between degree of error and PTAs and age. Computation, estimation and figures were made mainly using Matlab (R2014a; Mathworks, Natick, MA, USA) (Mathworks, 2014a). Data are presented as mean ± standard deviation (SD) and an outlier was defined as greater than the mean 2 SD.
RESULTS
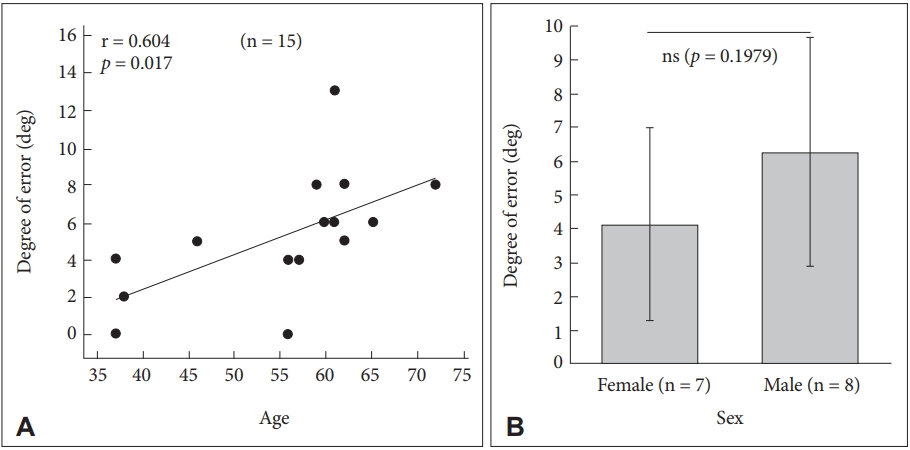
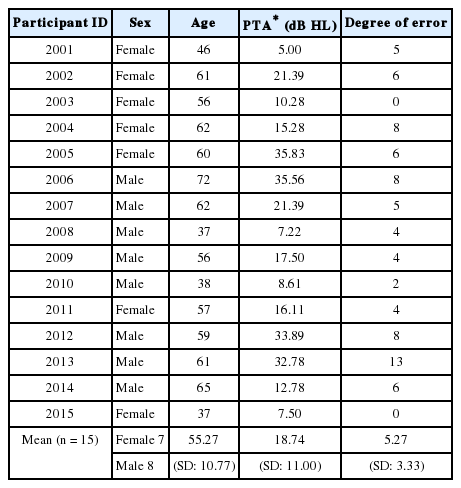
Mean age was 55.27 ± 10.77. Mean degree of error was 5.27° ± 3.33° and mean PTA (full range) was 18.74 ± 11.00 dB HL (Table 1). As expected, the degree of error and the percent correct showed negative correlation (r = 0.754, p = 0.0046). As shown in Figure 2, age was positively correlated with localization error (r = 0.604, p = 0.017), while men and women did not show any group difference in sound localization error (not-significant, p = 0.1979).

Age (A) and sex (B) in localizing sound source. All mean data are from both ears. deg: degree, ns: not-significant.
PTAs using three different averaging methods
All three averages and the sound localization resulted in significant positive correlation (Full9, r = 0.695, p = 0.004; Weight6, r = 0.609, p = 0.016; Comp6, r = 0.622, p = 0.013) as shown in Figure 3. We also tested with smaller number of samples (n = 13) to ensure the sample size for statistical significance (Figure 4).

Sound source localization error by the function of mean PTA by full range frequencies (A), by weighted averaging (B), and by averaging 6 frequencies (C) using 15 subject data. All mean data are from both ears. Full9: averaging full range frequencies tested, Weight6: weighted averaging of 6 frequencies used for diagnosing hearing disability, Comp6: averaging 6 frequencies used for Enforcement Decree of Industrial Accident Compensation Insurance Act. PTA: pure tone average, deg: degree of error.

Sound source localization error by the function of PTA by full range frequencies (A), by weighted averaging (B), and by averaging 6 frequencies (C) using 13 subject data. All mean data are from both ears. Full9: averaging full range frequencies tested, Weight6: weighted averaging of 6 frequencies used for diagnosing hearing disability, Comp6: averaging 6 frequencies used for Enforcement Decree of Industrial Accident Compensation Insurance Act. PTA: pure tone average, deg: degree of error.
Since sound localization required both ears, we wanted to know whether asymmetric hearing or hearing level at certain frequencies may affect more to localization. Among the participants, two were asymmetric based on the definition of differences bigger than 15 dB HL at three contiguous frequencies (Prasad & Cousins, 2008). Listeners with asymmetric hearing showed larger degrees of error (5.5 degree) than those with symmetric hearing (4.9 degree) but any statistical testing was not possible. Table 2 summarizes the correlation result in the difference of hearing between both ears at 9 frequency ranges and none are significant.
DISCUSSIONS
This is the first study addressing sound localization in respect to three different pure tone averaging formulae frequently used in Korea. Though guidelines to a unified testing are available in some test areas such as single-sided deafness and tinnitus, various regulations apply various standards. Criteria for the hearing impairment grading in Korean disable welfare law are based on the evaluation of hearing impairment and are applied for compensation, indemnification or welfare policy of the disabled. Therefore, three formulae were used in the current study to examine correlations with sound localization error: full frequency range averaging, PTA by weighted averaging of 6 frequencies used for rating disability and PTA by averaging 6 frequencies applying for Enforcement Decree of Industrial Accident Compensation Insurance Act. Despite the small size of the sample, the current study resulted in quite a stable statistical significance. Future study will include the standards for National Pension of Korea.
As expected, sound localization is affected by hearing level and age. Since various formulae for PTA are in use in the clinical and legal environment, we examined the three different averaging formulae in regard to sound localization in healthy participants. All three methods resulted in reliable significance, with slightly different statistical strengths among three, though. If sound localization error can be used as one of the treatment outcome measures of hearing-aids, cochlear implantation, or other otological problems (Carette et al., 2014; Gifford et al., 2014; Liu et al., 2018), normative distribution along varying PTA is necessary. Though the sample size is still small, the result of this study may contribute to build normative data for sound localization distribution in various hearing levels within normal range.
Unlike our expectation, the difference of hearing between both ears did not show any statistical significance in localizing sound in the current result. We must admit that this was due to the relatively smaller difference in our participants. With bigger difference, such as in asymmetric hearing or single-sided deafness, we could observe the effect of difference between the ears in locating sound source.
Acknowledgements
This research was supported by the National Research Foundation (NRF) of Korea (NRF-2018R1A2B6004788).
Notes
Ethical Statement
The present study was approved by the Institutional Review Board of Hallym University of Graduate Studies (HUGSAUD148672) and was conducted in compliance with the Declaration of Helsinki, International Conference on Harmonisation Guidelines for Good Clinical Practice.
Declaration of Conflicting Interests
There are no conflict interests.
Funding
This research was supported by the National Research Foundation (NRF) of Korea (NRF-2018R1A2B6004788).

